
Service Performance Monitoring (SPM)
Service Performance Monitoring surfaces in Jaeger UI as the "Monitor" tab and helps identify interesting traces without requiring prior knowledge of service or operation names. The feature aggregates span data to produce RED (Request, Error, Duration) metrics.
UI Feature Overview
The Monitor tab provides service-level and operation-level aggregation of:
- Request rates
- Error rates
- Durations (P95, P75, P50)
An "Impact" metric is computed as the product of latency and request rate, helping identify operations with high business impact despite varied latency profiles.
Architecture
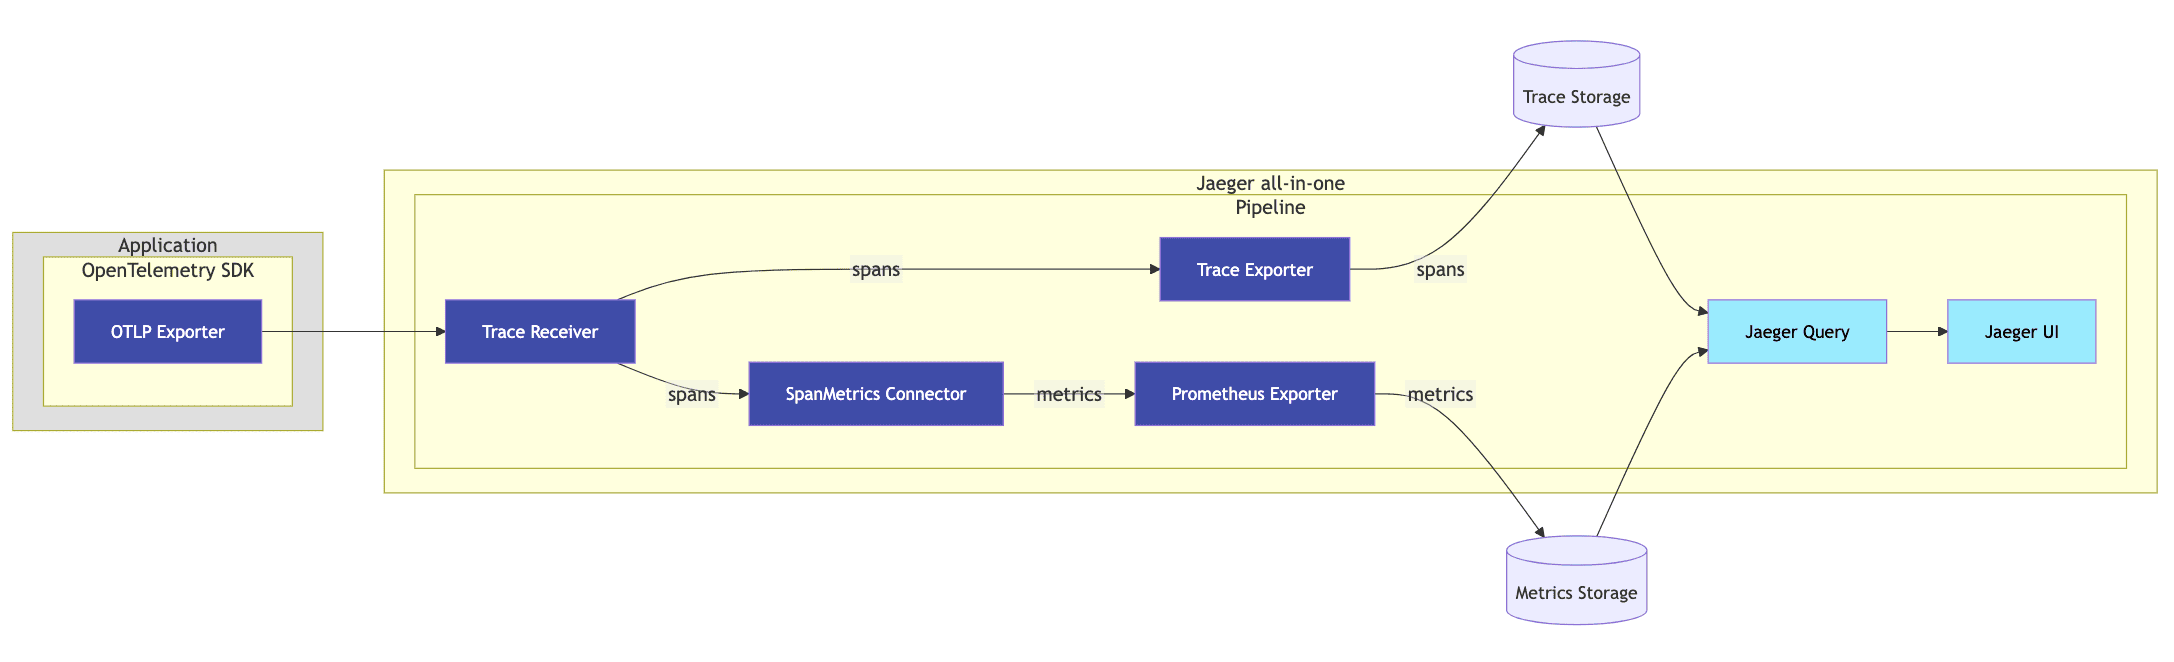
The SpanMetrics Connector receives spans and generates metrics exported to a PromQL-compatible backend. Jaeger Query then retrieves these pre-computed metrics. This approach requires:
- A SpanMetrics Connector is introduced in the pipeline that receives trace data (spans) and generates RED metrics.
- An external Metrics Store that supports PromQL queries.
- A configuration in the
jaeger_queryextension to reference the external metrics store.
Because the connector aggregates spans into in-memory series, each (service, operation) time series must be produced by a single writer. With one collector replica this holds automatically. To scale out, spans must be load-balanced by service so that every service is aggregated on exactly one instance; otherwise the RED metrics are double-counted and become inaccurate. See Configuration for the resulting two-tier setup.
Derived Time Series
The SpanMetrics Connector generates two metric names:
traces_span_metrics_calls (counter type)
- Counts total spans, including error spans
- Call counts differentiated from errors via the
status_codelabel - Errors identified as time series with label
status_code = "STATUS_CODE_ERROR"
traces_span_metrics_duration (histogram type)
- Histogram of span durations/latencies
- Creates additional time series:
traces_span_metrics_duration_count: Total data points across bucketstraces_span_metrics_duration_sum: Sum of all data point valuestraces_span_metrics_duration_bucket: Collection of time series for each bucket
Estimated time series calculation:
Configuration
SPM runs in two tiers so that the stateful SpanMetrics Connector always sees each service from a single writer, which keeps the RED metrics accurate even when both tiers run with multiple replicas.
Front OpenTelemetry Collector — load-balance spans to the backend by service:
Jaeger — run the SpanMetrics Connector and expose the generated metrics on a Prometheus endpoint:
The exporter and the Jaeger metrics reader must agree on metric names. By default Jaeger queries suffix-less names such as traces_span_metrics_calls (the normalize_calls and normalize_duration options of the prometheus metric backend default to false), so the exporter must not append Prometheus-style suffixes. Set translation_strategy: UnderscoreEscapingWithoutSuffixes explicitly for this: the older add_metric_suffixes: false option is deprecated and silently ignored since Jaeger v2.20.0 (collector-contrib v0.154.0), which would rename the metrics to traces_span_metrics_calls_total and break the Monitor tab.
Define a remote PromQL-compatible storage in Jaeger:
Reference the metrics store in the jaeger_query extension:
Once a metrics store is referenced by jaeger_query, the Monitor tab appears in the Jaeger UI automatically. Its visibility is derived from the storage capabilities reported by the backend, so no additional Jaeger UI configuration file is required.